Rule Validation Results
Overview
The Rule Validation Results widget shows how data quality rules performed in the current run and how those results compare with the average of the last 5 runs. It helps users understand whether data meets defined quality rules and identify rules that are producing invalid results.
This widget is part of the Data Quality Processor Results dashboard and presents rule outcomes for both aggregate and non-aggregate rules in a single, consolidated view.
What the Widget Analyzes
Profiling dimension: Rule validation outcomes
Level of analysis:
-
Dataset-level rule results
-
Column-level rule results
-
Rule-level summaries
Calculation basis:
-
Each configured data quality rule is evaluated during the run
-
Rules are classified as Aggregate or Non-Aggregate
-
Rule outcomes are marked as Valid or Invalid
-
Counts are calculated for each rule
-
Current run results are compared with the average of the last 5 runs
This analysis helps detect rules that consistently fail or show changes in behavior over time.
What the Widget Shows
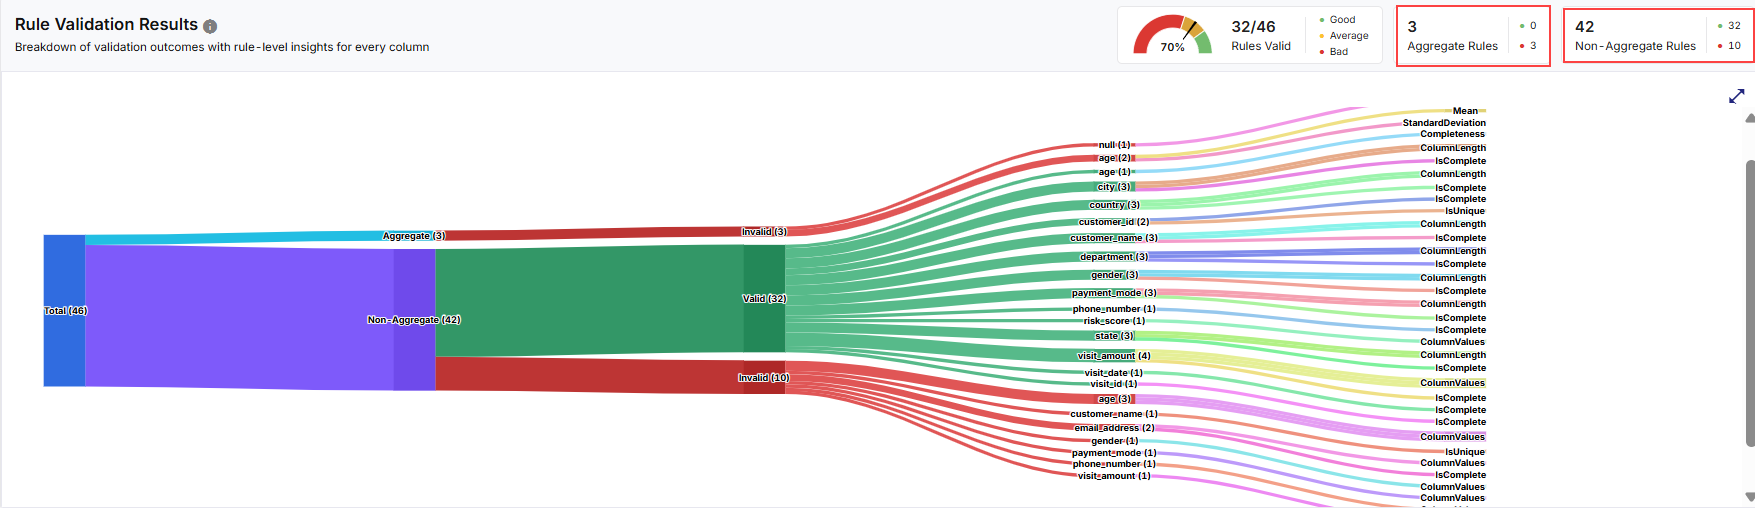
The widget displays:
-
A Sankey-style flow visualization showing how rules move from total evaluated rules into valid and invalid outcomes
-
Clear separation of Aggregate and Non-Aggregate rule results
-
A tabular summary pane listing rule-level validation details
-
Color indicators to highlight validation outcomes and trends
Aggregate and Non-Aggregate Rules
Both rule types are shown together in this widget to provide a complete view of rule performance.
Aggregate Rules
-
Evaluated at an aggregated level
-
Use summary calculations such as count, percentage, or threshold comparison
-
The rule result represents the dataset or column as a whole
Non-Aggregate Rules
-
Evaluated at the record or column value level
-
Each record contributes individually to the rule result
-
Examples include format checks, null checks, or range validations
Validation Statuses
The validation statuses apply to both aggregate and non-aggregate rules. The widget uses the following rule validation statuses:
|
Status |
Meaning |
|---|---|
|
Valid |
The rule conditions were satisfied |
|
Invalid |
The rule conditions were not satisfied |
How to Read This Widget
Sankey Visualization
-
The flow starts with Total rules evaluated, then the flow splits into:
-
Aggregate Rules
-
Non-Aggregate Rules
-
-
Each of these paths further splits into:
-
Valid
-
Invalid
-
-
Individual rules appear under their respective categories
-
The thickness of each flow represents the number of rules contributing to that path.
-
Hovering over any flow displays a detailed view of rule validation outcomes including:
-
Rule Type (Aggregate / Non-Aggregate)
-
Validation Status (Valid / Invalid)
-
Counts or percentages
-
Trend indicators comparing current run vs last 5 runs
-
This flow allows users to quickly identify which rules failed and understand their type and impact.
Rule Results Table
The table provides an overview of rule results on the top right of the widget. It includes:
-
Rules Valid
-
Aggregate Rules
-
Non-Aggregate Rules
This table allows users to quickly understand the count and percentage of valid rules including aggregate and non-aggregate rules.
Widget Interactions
The widget supports the following interactions:
-
Hover over Sankey flows to view tooltips with rule counts and percentages.
-
Click a rule to open detailed validation information for that rule.
-
Click supported indicators to open a trend comparison view showing current run results versus the last 5 runs.
-
Click the download icon to export the result as PDF, CSV, or XLSX file. You can either download a consolidated file or individual widgets.
-
Download individual widgets to analyze specific visualizations in detail and gain deeper insights. Files are saved using a standard naming format by default, which you can rename locally after download:
<Data Quality Stage name>_<Source Table name>.<pdf | csv | xlsx>
Example: RuleValidationResults_bankrecords.csv
-
For consolidated Excel downloads, each widget is exported to a separate worksheet. For example, three widgets are saved as three sheets within a single Excel file.

Note:
The widget interactions are read-only and do not modify data or rules.
-
Available Views
This widget supports a single Sankey visualization view combined with a rule results table. The layout is optimized for quick validation review and navigation.
On the top-right corner of the Sankey graph, use the:
-
Expand icon to visualize a larger view of the graph for improved readability
-
Collapse icon to restore the graph to its default size
Note:
All displayed information is read-only.
How to Interpret the Results
-
A strong Valid flow for both rule types indicates good data quality.
-
Invalid Non-Aggregate rules often point to record-level data issues.
-
Invalid Aggregate rules indicate dataset-level or column-level threshold failures.
-
Sudden changes compared to the last 5 runs may indicate data drift or upstream changes.
When to Use This Widget
-
To review validation results for all rule types
-
To distinguish between aggregate and non-aggregate rule failures
-
To monitor rule performance trends across runs
-
To prioritize rules for investigation or remediation
-
To validate data readiness before downstream processing
 Recommended Topics Recommended Topics
|
What's next? Issue Resolver Results |